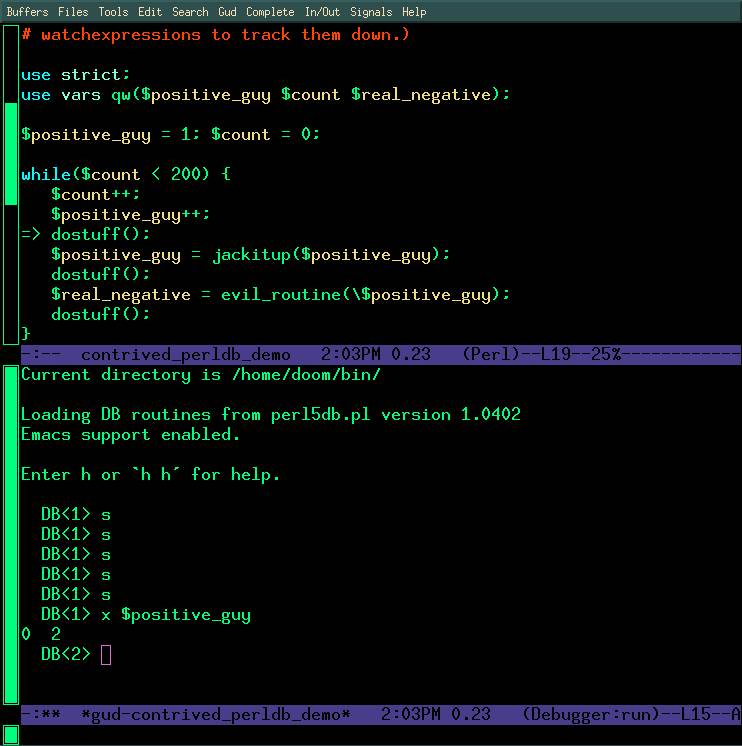
The perldb works really well inside of emacs: you get a two window display, one window shows the shell/REPL area where you type debugger commands and the other shows the code it's tracing, with a "=>" superimposed, pointing at the next line that will be executed.
A screen shot: http://obsidianrook.com/devnotes/talks/perl_debugger/Images/emacs_perldb_big_color_screen.jpg
It's not the main way that I debug things, but if I'm feeling completely at sea about what some code is doing, playing with perldb is one of the tricks I might used to get oriented.
The "m" command is particularly interesting: it gives you a list of all available methods on a class or object. It's not very easy to get that information in any other way.
I wrote a tutorial on using it a long time ago (it's a bit dated, and probably a bit long).
In reply to Re^2: [EMACS] "Emacs as Perl IDE" - Abstract for YAPC::EU 2016
by doom
in thread [EMACS] "Emacs as Perl IDE" - Abstract for YAPC::EU 2016
by LanX
| For: | Use: | ||
| & | & | ||
| < | < | ||
| > | > | ||
| [ | [ | ||
| ] | ] |