adarnk hit most of my points.
1 ->> Anti-aliased lines and labels.
1994 called - it wants its fonts back.
2 ->> Better-looking charts
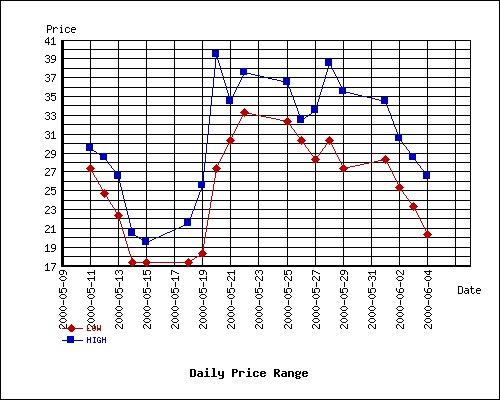
Given the choice between displaying a composite line chart using
DBD::Chart
or
Dundas
I can see how it really would just depend on what you are trying to do.
3 ->> Object-oriented API/DOM
I think a DOM-style API to the chart would be great.
4 ->> Smooth vector-style colors, gradients, alpha and shading
This is pretty standard across even low-end commercial packages. There's got to be some way to generate smooth graphics.
5 ->> Professional Appearance
When I am making a chart for myself to see how many emails a server is bouncing, I'll use whatever tool will get the job done. This might just be HTML.
However, when I am putting together some charts for a commercial tool (i.e. - CRM suite), I would like to have something that looks as good as the rest of the design (and still presents the information in a concise way).
Posts are HTML formatted. Put <p> </p> tags around your paragraphs. Put <code> </code> tags around your code and data!
Titles consisting of a single word are discouraged, and in most cases are disallowed outright.
Read Where should I post X? if you're not absolutely sure you're posting in the right place.
Please read these before you post! —
Posts may use any of the Perl Monks Approved HTML tags:
- a, abbr, b, big, blockquote, br, caption, center, col, colgroup, dd, del, details, div, dl, dt, em, font, h1, h2, h3, h4, h5, h6, hr, i, ins, li, ol, p, pre, readmore, small, span, spoiler, strike, strong, sub, summary, sup, table, tbody, td, tfoot, th, thead, tr, tt, u, ul, wbr
You may need to use entities for some characters, as follows. (Exception: Within code tags, you can put the characters literally.)
| |
For: |
|
Use: |
| & | | & |
| < | | < |
| > | | > |
| [ | | [ |
| ] | | ] |
Link using PerlMonks shortcuts! What shortcuts can I use for linking?
See Writeup Formatting Tips and other pages linked from there for more info.